Visualizing traces
By default, the application will forward all it's traces to an opentelemetry collector, which forwards traces to a local jaeger installation.
Both containers can be created through docker-compose up -d.
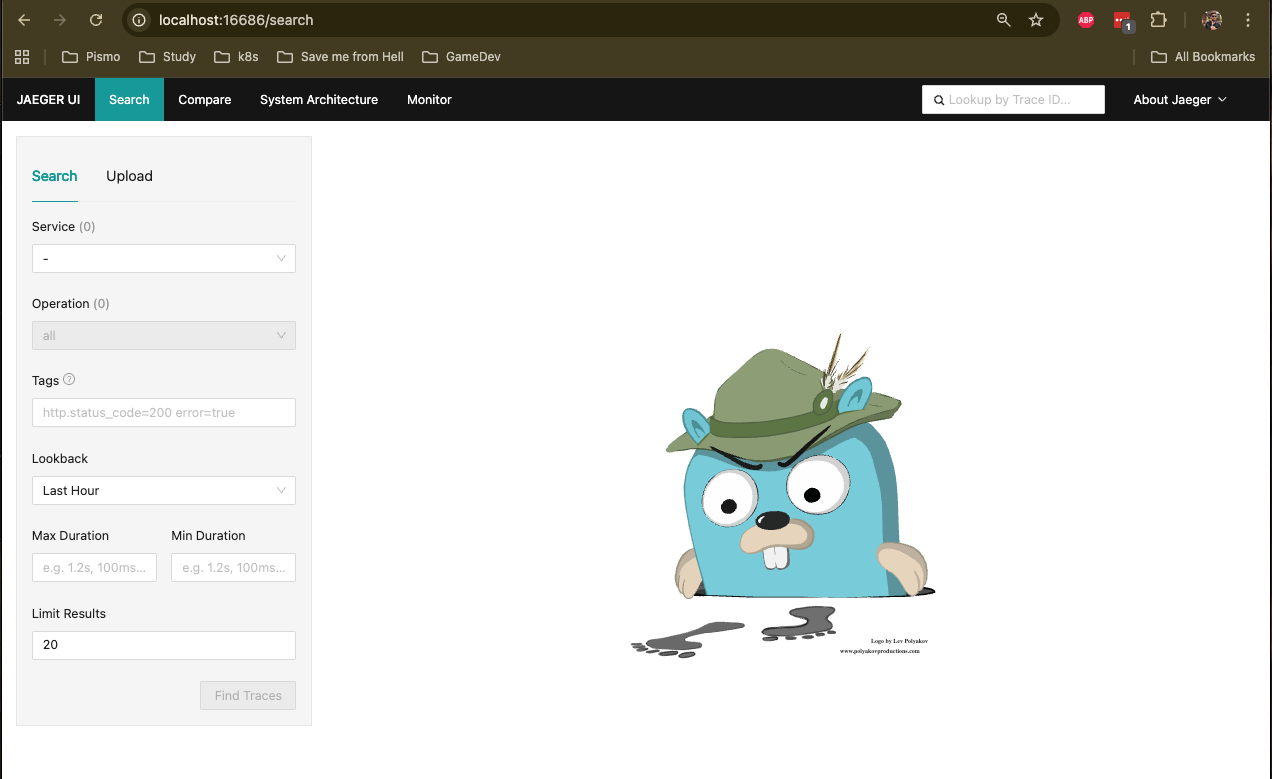
To access jaeger UI local container, simply access: http://localhost:16686:
Generating traces
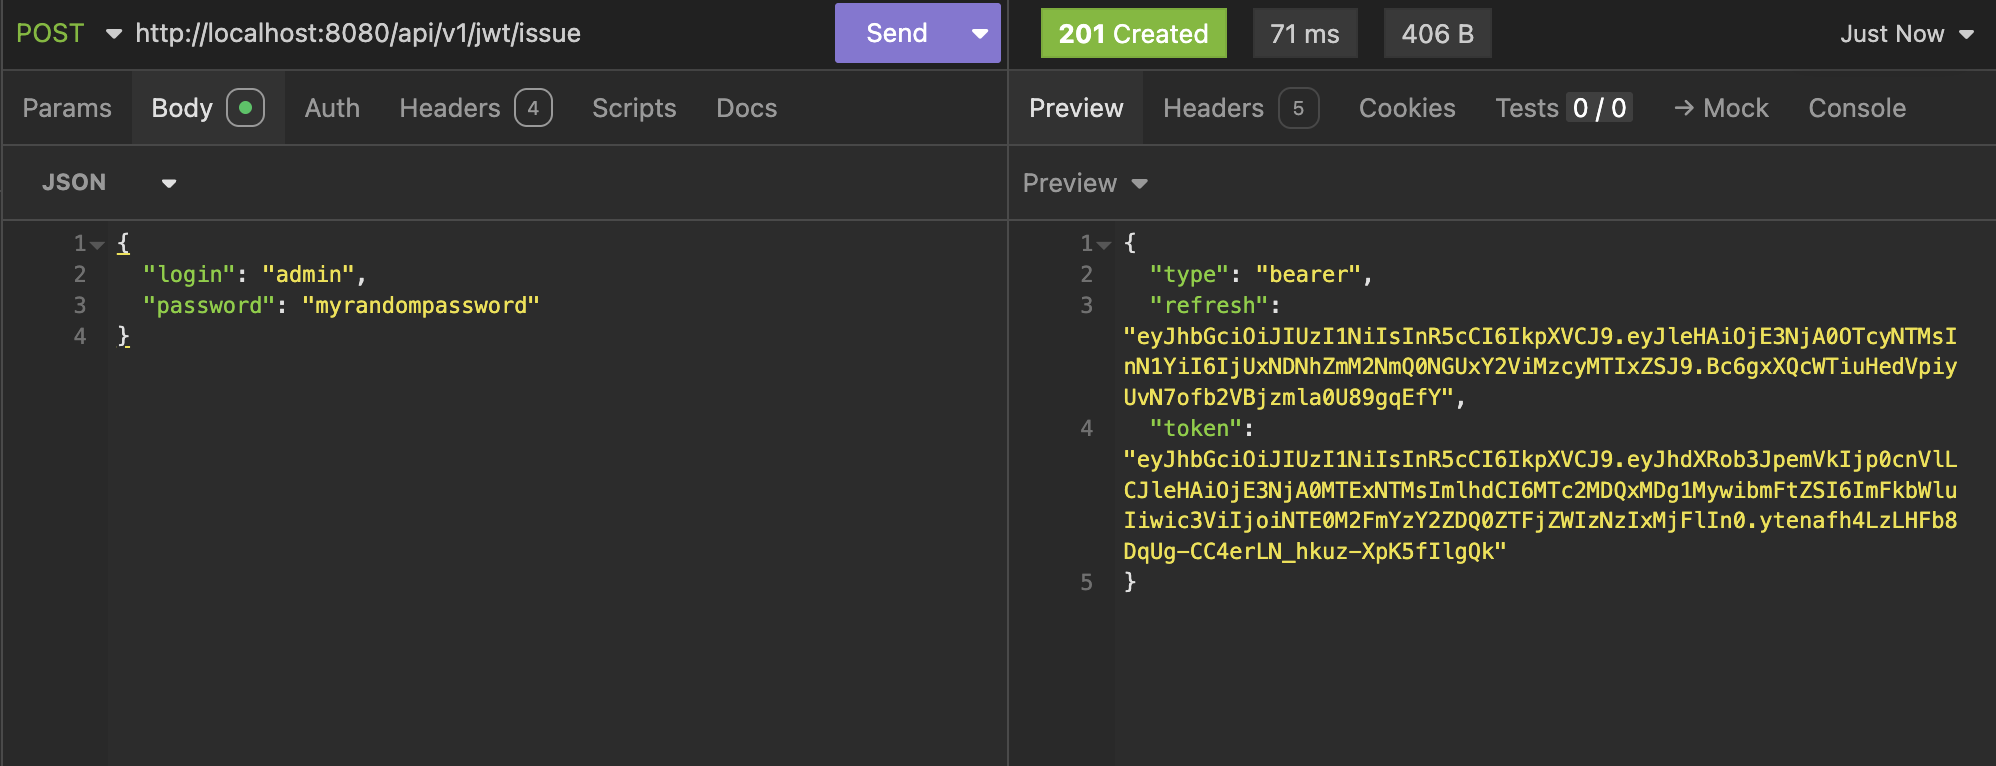
Let's explore a new request and see it's flow through the traces. Let's say I have a valid user and I would like to generate a new token:
Observing traces through Jaeger
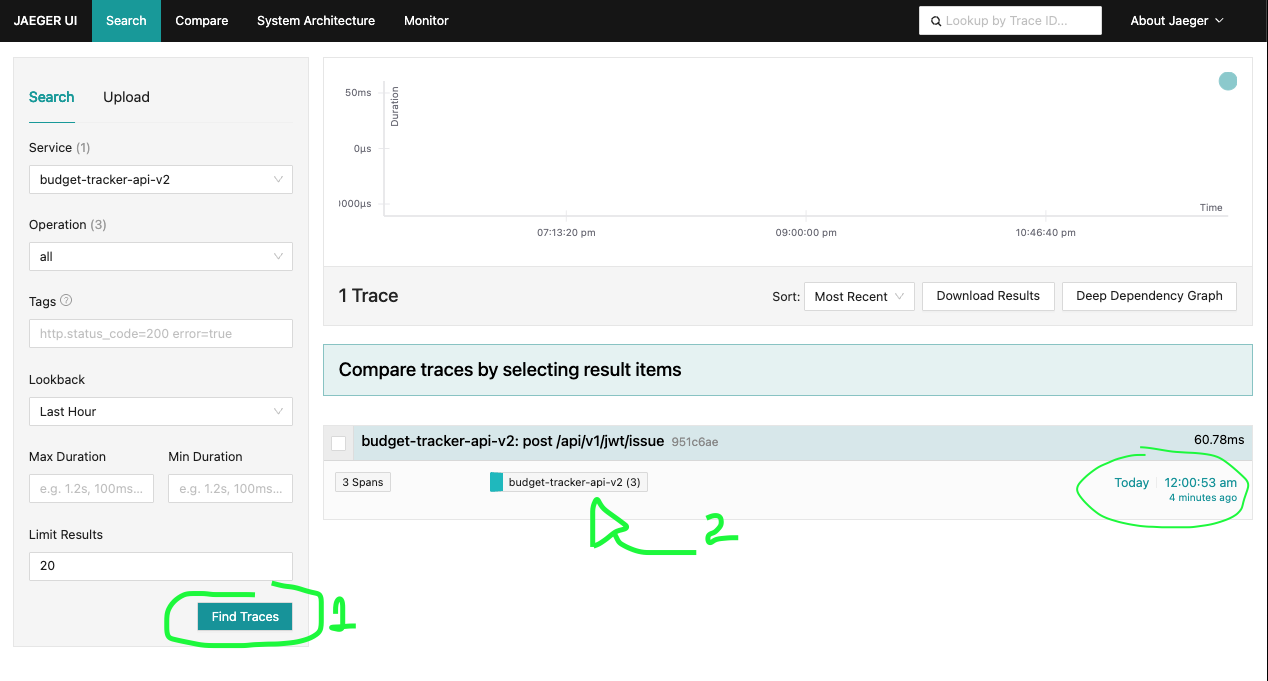
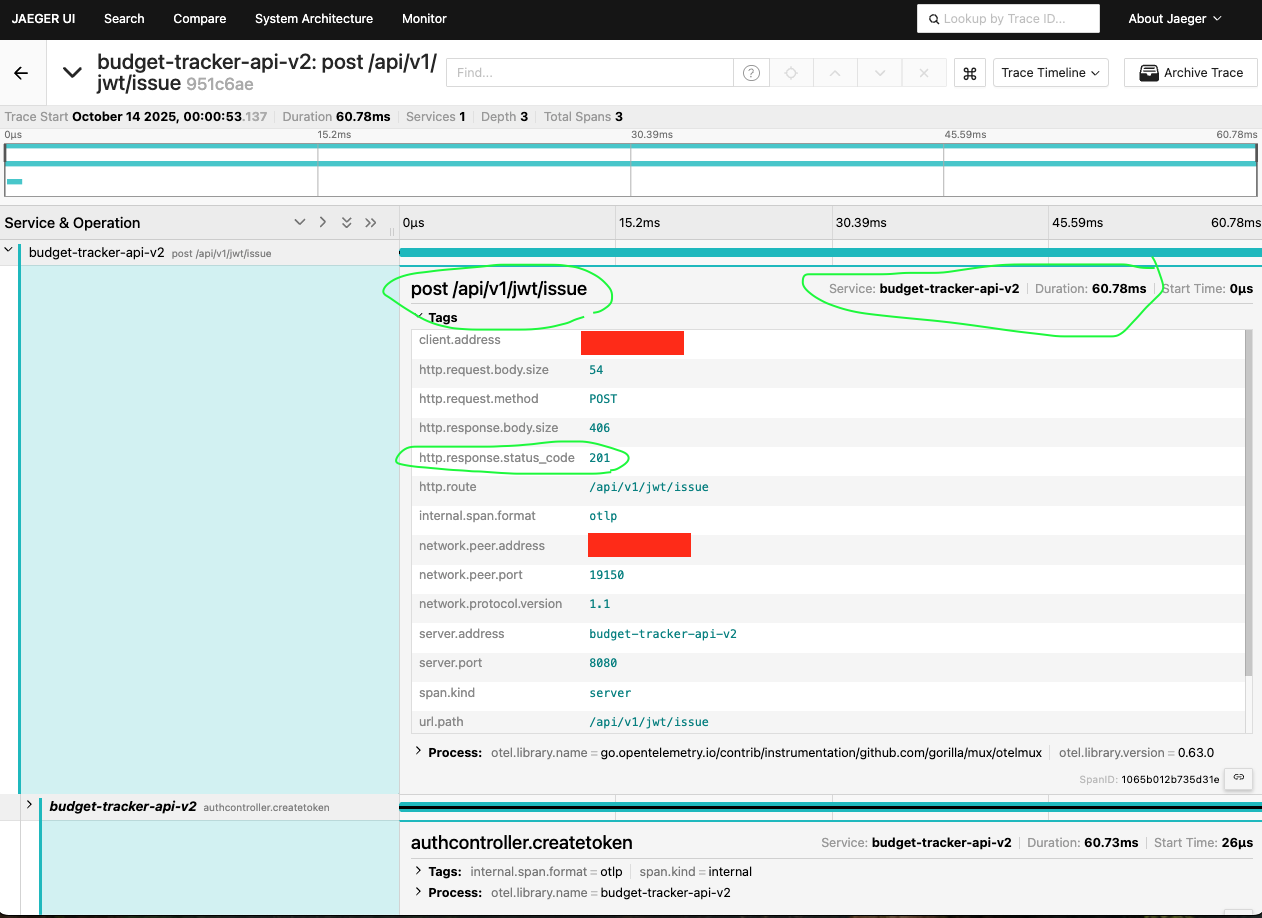
Now that you completed the request and got a 201, let's see how it ends up within our tracing-platform. Through Jaeger: go to the home page and click in Find Traces button.
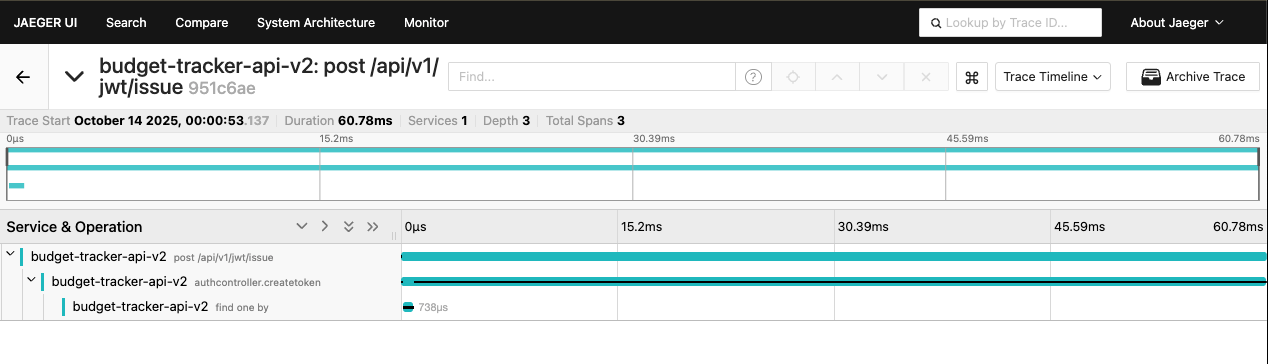
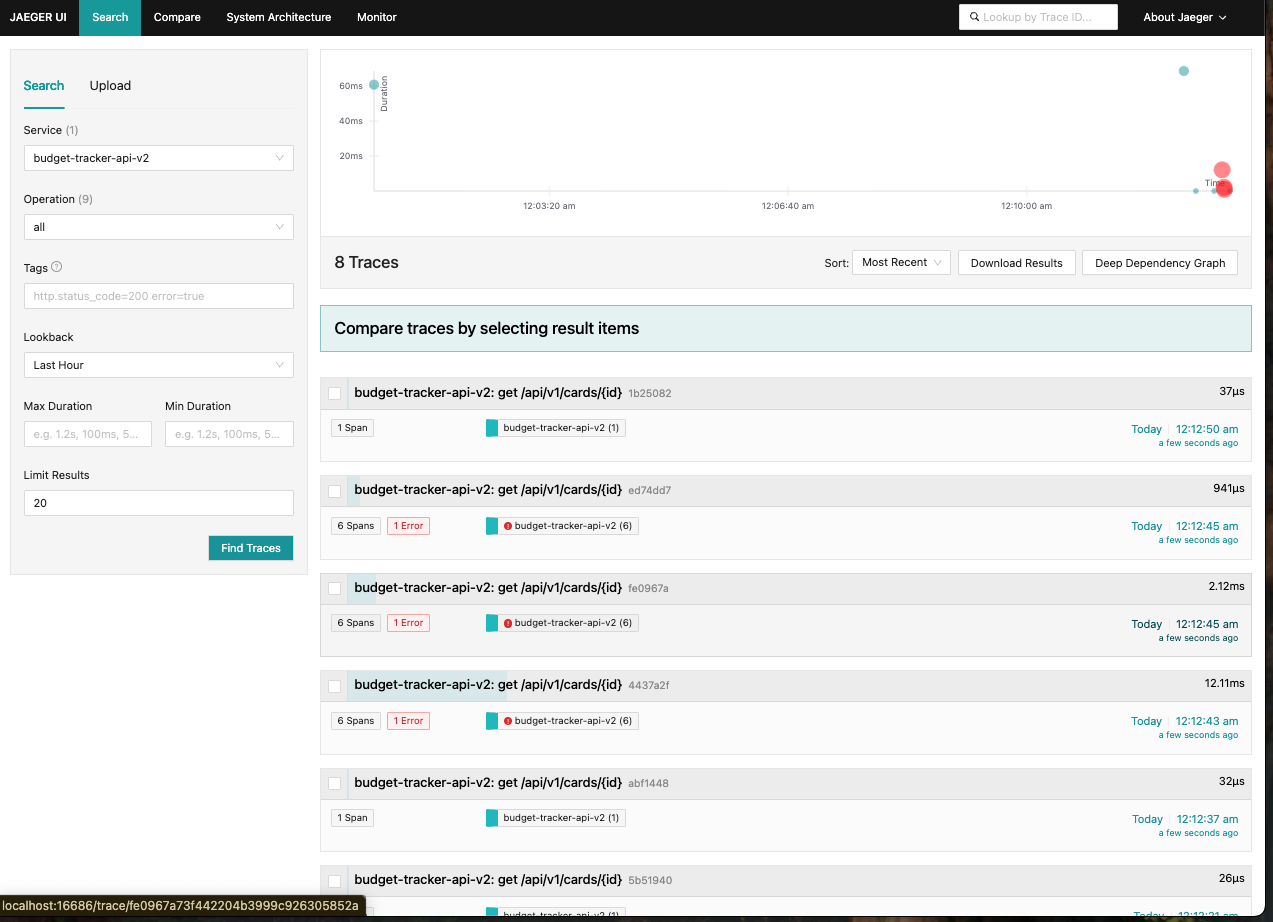
This is how Jaeger will looks like after a few different requests: